|
Last month I wrote a post about the massive potential for Google Forms in education and you can't really talk about Forms without mentioning Google Sheets. Though Sheets is its own application within the Google Apps for Education (GAFE) it is the default collection spot for Form responses and is still the best choice when looking to sort and analyze data you've collected. When Form data comes into a Sheet it is organized by TimeStamp, Username (if you create it under a organization account and opt to require and collect it), and then each question's response. The order of the responses going left to right across the sheet matches the order in which you created questions on the Form. A great new update is the ability to move the columns (aka the question/responses) to any location on the x-axis. This used to be prevented because of the connections between the Form responses and the Sheet, but now you can arrange the responses how you see fit without out affecting the Form. 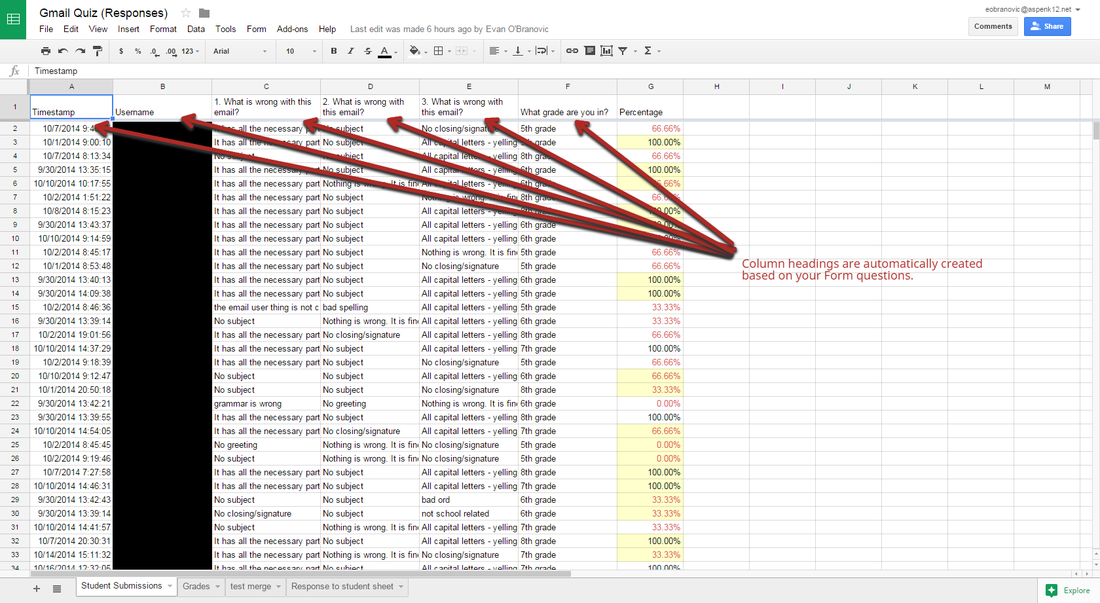 By freezing the first row with the Form questions you can scroll through a large amount of data and keep track of what question you're reading a response to. Quick tips:
Here are some great add-ons and tools you can use in Sheets to work with Form data: Flubaroo: Great add-on that lets you create an answer key and grade submitted forms. The grade report is created on a separate tab for easy viewing. An answer report can be emailed to the Form respondents identifying their correct and incorrect responses. After you run Flubaroo once you can set it to auto-grade any new incoming responses. SuperQuiz: A more in-depth tool to work with Forms and Sheets to create quizzes and assessments. Check out this video to get a full explanation of how to set it up and make it work for you and your students. WorkFlow: A new add-on that helps increase the productivity and collaboration of working with information on a Sheet. The WorkFlow add on lets you send an approval request to someone to let them know they need to look at something contained within your Sheet and respond which in turn lets you know they've seen it. If you start to explore the use of forms as a way for staff to register for events and PD using WorkFlow is helpful to keep all interested parties informed of changes and stay updated on incoming information. Autocrat- This is an amazing mail merge add-on that lets you create form letters and customize them with information collected in a Sheet. It works really well to send confirmations of Form data when you want your respondents to be aware or remember the responses they gave you. (i.e. reminding respondents who have used a form to register for an event) It allows for a PDF or Google Doc letter created and the ability to automatically email your merged document. SaveAsDoc: If you've ever tried collecting paragraph style answers in Forms you know how difficult it can be to try and efficiently review the responses without giving yourself a headache. Using the SaveAsDoc add-on can save your eyes and sanity by taking each set of responses and created a running Doc that is much easier to read and can even be easily printed out if you want respondents to review their answers. Each question becomes a bold heading with the responses below. Notifications: By going to the 'Tools' menu and selection 'notification rules...' you have a few simple options to have emails sent you when any changes are made or when a user submits a form. You can receive these notifications in an immediate email or in a daily digest. This is a great way to keep track of Form submissions without having to leave the response sheet open and keep refreshing.  Using Flubaroo is a great time saver when grading Form data. Conditional Formatting: Conditional Formatting is a built-in tool that allows you to color code Sheet cells based on a value, or range of values you identify. This is great to identify specific or correct answers quickly as responses come in or to go more in-depth with your analysis of any amount of data by creating flags for certain benchmarks. Sorting and Filtering - Every column allows you to do a simple ascending or descending sort A-Z, but you can also enable the 'Filter' feature for a more in-depth sorting to help organize the data you want to see. 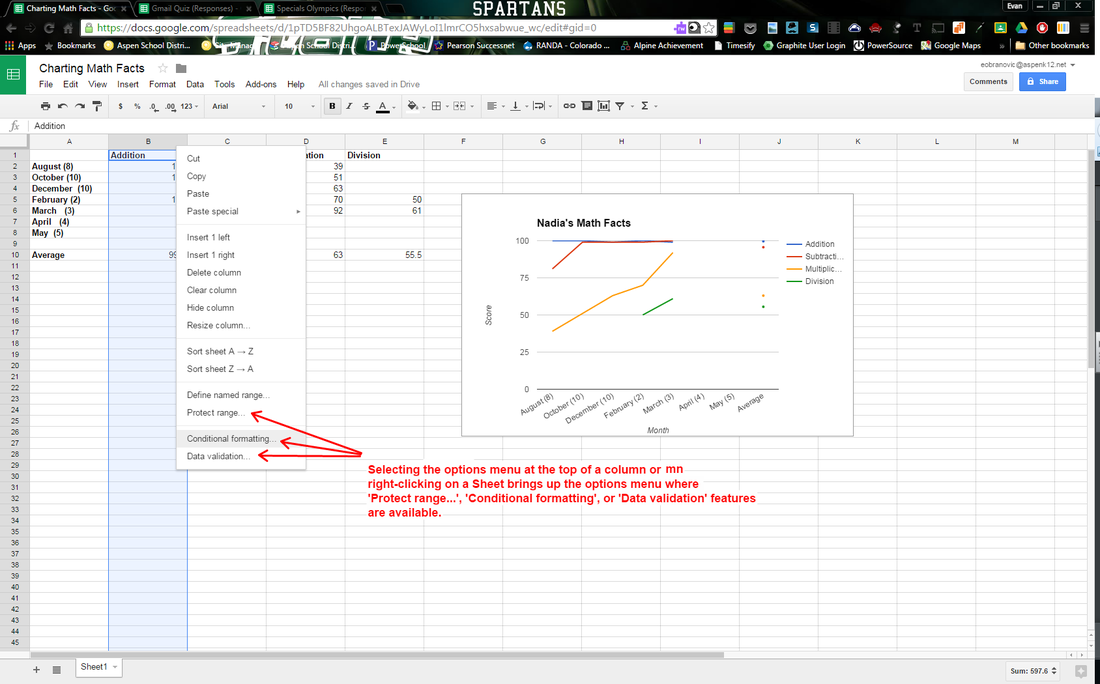 In addition to collecting Form data, Sheets works as a cloud spreadsheet that can be used to collect, organize, and analyze data. Graphs and charts can be created to make visual representations of data collected. You can even make the visuals living documents so they grow when new data has been added. In the past I've had students record their monthly math fact scores and track their progress. The Specials teachers in my district use a form to collect behavior data from each class and chart their progress to reward positive behavior. If you're not sure of how to best chart or graph the data you have collected in a Sheet, Google has added the 'Explore' feature that suggests various ways to chart and analyze the data you've collected. Pivot tables- This is a whole other beast when it comes to sorting and organizing data within a Sheet. The Pivot table allows you to reorganize massive amounts of data and add various values and fields to shape the data in a way that works for you. In order to achieve the growing/living chart for Specials behavior as I mentioned earlier a Pivot table was needed in order to separate the grade-levels and teams so the data was useful and specified enough to allow teachers and students to quickly look at their progress. 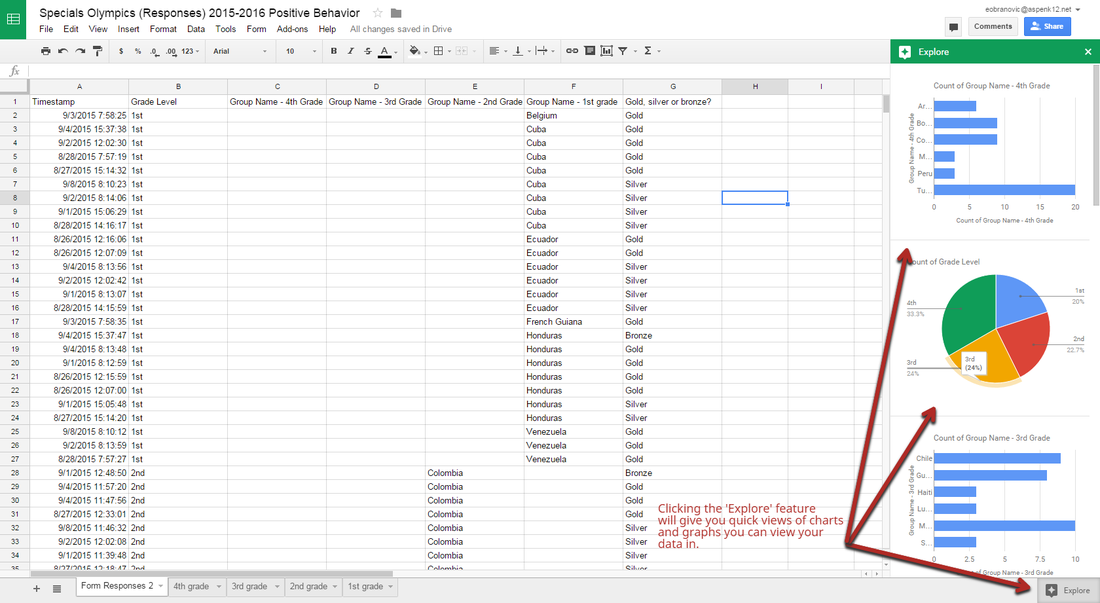 Explore is a new feature that helps get you started with using charts to view and analyze your Sheet data. 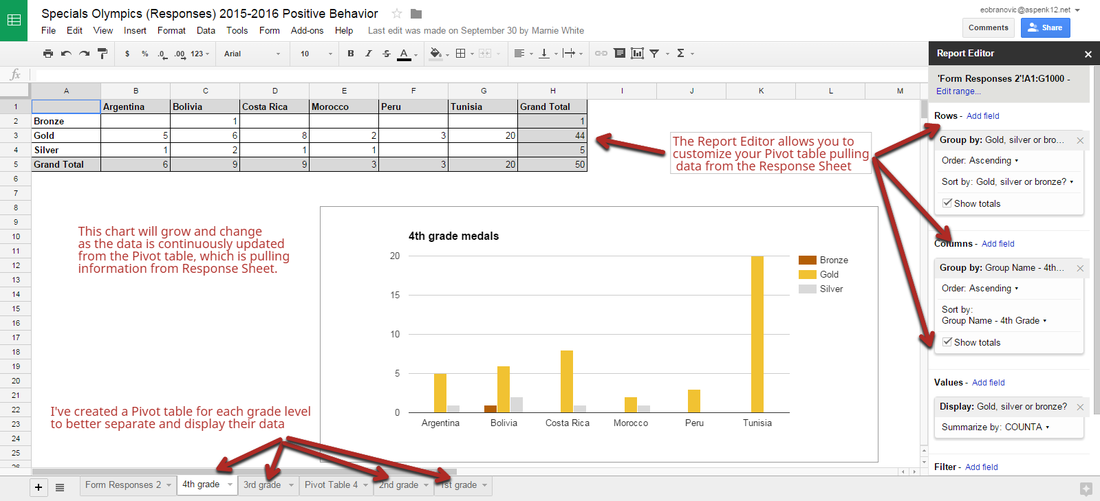 Here I've combined using a Pivot table and graph to create a custom visual for each grade level group. Now that you have several tools and places to start, don't be shy about getting into Sheets and using it to really dive into your data analysis and make some good decisions about your next steps. Feel free to comment below any additional tools or strategies you've found to be helpful.
|
About EvanDirector of Technology for Traverse City Area Public Schools. Level 2 Google Certified Educator. Former Tech Integration Specialist and 4th grade teacher at Aspen School District and Spartan for life! Go Green! 
Categories
All
Archives
February 2019
|
 RSS Feed